Facebook Growth and Outlook
Facebook is the biggest online social media and social network. The company is based in Menlo Park, California. Currently the company has market-cap of $500B.
The company held its initial public offering (IPO) in February 2012, and began selling stock to the public three months later, reaching an original peak market capitalization of $104B, a new record in Wall Street. Facebook makes most of its revenue from advertisements.
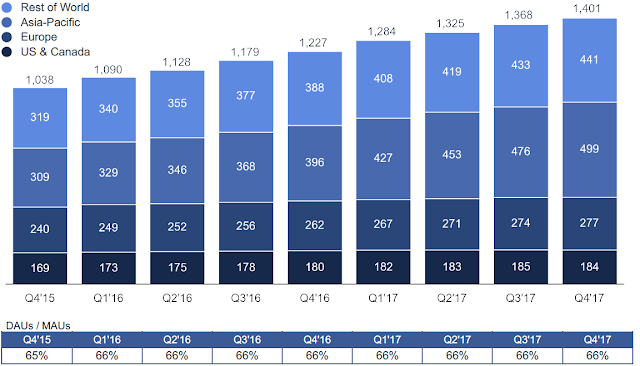
The company reached one-billion monthly active users (MAUs) by 2013. During 2017Q2, it reached another milestone of two-billion MAUs. The chart below shows the steady growth of daily active users (DAUs) globally. DAUs/MAUs ratio stays stable at 66%.
History
The Facebook website was launched on February 4, 2004, by Mark Zuckerberg, along with fellow Harvard College students and roommates.The company held its initial public offering (IPO) in February 2012, and began selling stock to the public three months later, reaching an original peak market capitalization of $104B, a new record in Wall Street. Facebook makes most of its revenue from advertisements.
The company reached one-billion monthly active users (MAUs) by 2013. During 2017Q2, it reached another milestone of two-billion MAUs. The chart below shows the steady growth of daily active users (DAUs) globally. DAUs/MAUs ratio stays stable at 66%.
 |
| DAUs in Million |
Revenue
The chart below shows revenue growth in the last 4 years. There is NO sign of slowing down. Growth rate is about 48% per year in 2017.
Most of the revenue comes from advertising, as shown below. The fastest growth region in 2017 is Europe. Facebook is the No.2 advertising giant behind Google.
Earnings per Share (EPS)
Price/EPS Ratio (PE)
Regardless the fast growing, Facebook stocks are traded at relatively low P/E ratio, as shown below. After the recent selloff, currently FB is traded below $172, and EPS in 2017 is $6.16. Trailing P/E ratio is below 28.
Outlook
For 2018Q1, Street Whisper numbers are $11.18B and $1.40. Facebook should beat these numbers easily. Facebook has beaten EPS in all the earnings in the last 4 years. The company has missed Revenue only once in 15Q1.
Street estimates EPS is $6.61 in 2018, $8.21 in 2019 and $10.06 in 2020. These estimates should be revised higher shortly.
If we assume 30% growth rate, it should be $8.0 in 2018, $10.4 in 2019 and $13.5 in 2020.
If we assume 40% growth rate, it should be $8.6 in 2018, $12 in 2019 and $16.8 in 2020.
Let's take the 30% growth to calculate forward P/E: 172/8 = 21.5. This means FB stocks are dirty cheap at current price. If it maintains P/E of 30, it should be traded around $240.
Disclosure:
I am long FB. My price target is $240 in 12 months, and $400 in 2020.


Varinder Singh | Facebook
ReplyDelete